library(magrittr)
library(ggplot2)動機
facetごとにfacetの大きさを自動で(あるいはマニュアルで)変えたい。
Load packages
縦方向に並べたfacetの大きさをスケール依存的に変える
tbl_plot <-
  paste("facet", 1:3) %>%
  purrr::imap(~ {
    tibble::tibble(
      facet = .x,
      x = seq_len(.y * 5),
      y = seq_len(.y * 5)
    )
  }) %>%
  dplyr::bind_rows()

gp <-
  tbl_plot %>%
  ggplot(aes(x, y)) +
  geom_point() +
  theme_minimal() +
  theme(
    panel.grid = element_blank(),
    panel.background = element_rect(fill = "grey90")
  )

# そのまま出力
gp_default <- gp + facet_grid(rows = vars(facet))

# 縦軸をfacetごとに自由に
gp_free_scale <- gp + facet_grid(rows = vars(facet), scales = "free_y")

# 大きさをfacetごとに自由に
gp_free_space <- gp + facet_grid(rows = vars(facet), scales = "free_y", space = "free_y")

# spaceだけfreeを指定しても意味はない
gp_only_space <- gp + facet_grid(rows = vars(facet), space = "free")

# 比較
patchwork::wrap_plots(
  gp_default + labs(title = "default"),
  gp_free_scale + labs(title = "free scale"),
  gp_free_space + labs(title = "free scale & free space"),
  gp_only_space + labs(title = "only free space"),
  nrow = 1)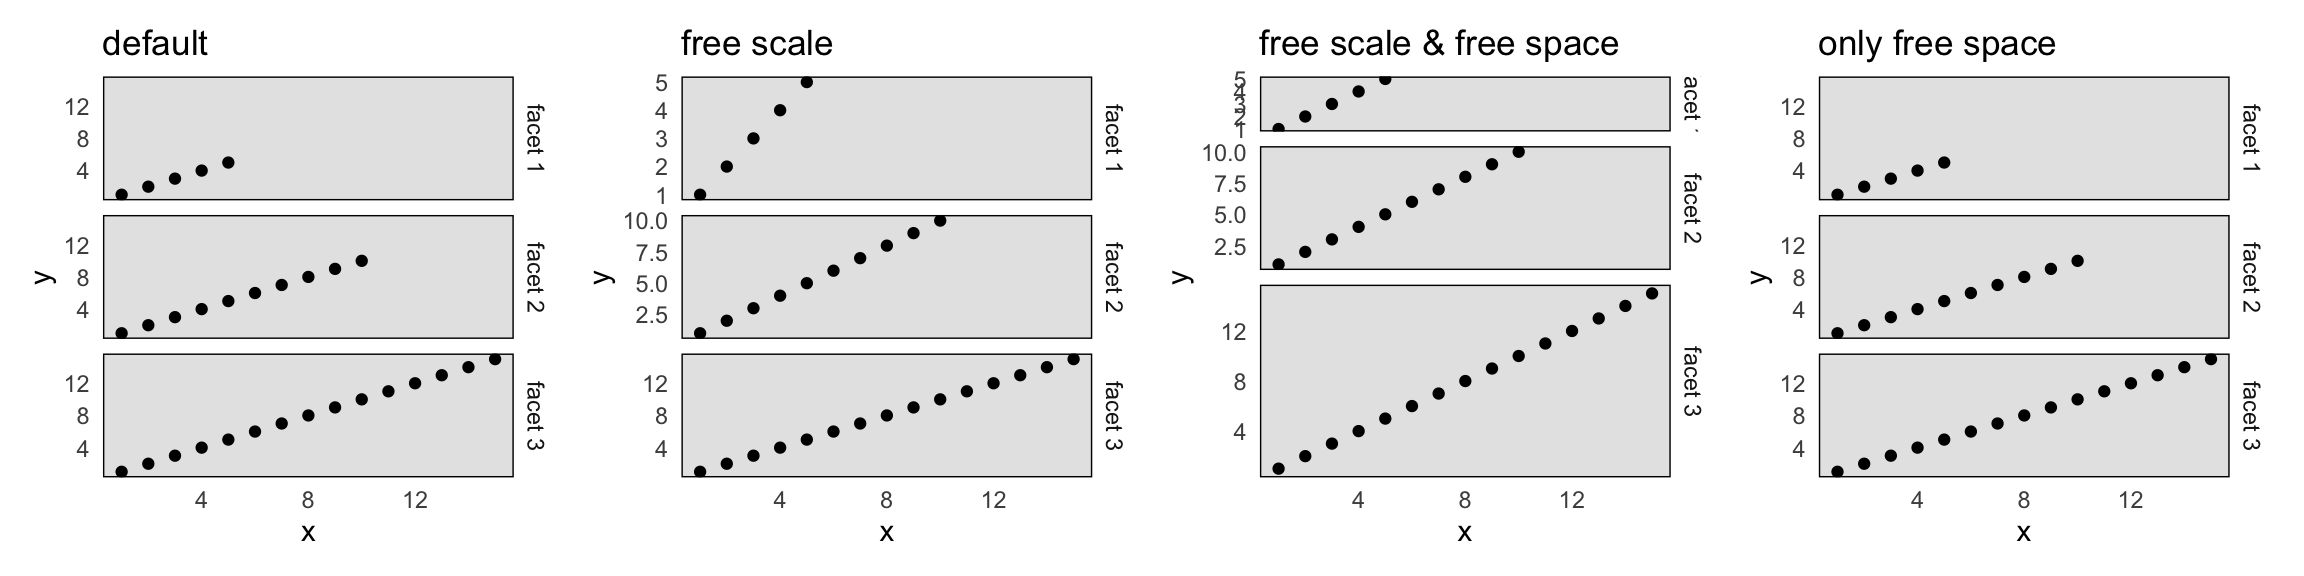
横方向に並べたfacetの大きさをスケール依存的に変える
# 横軸でもfacetの並びを変えればできる
gp + facet_grid(cols = vars(facet), scales = "free_x", space = "free_x")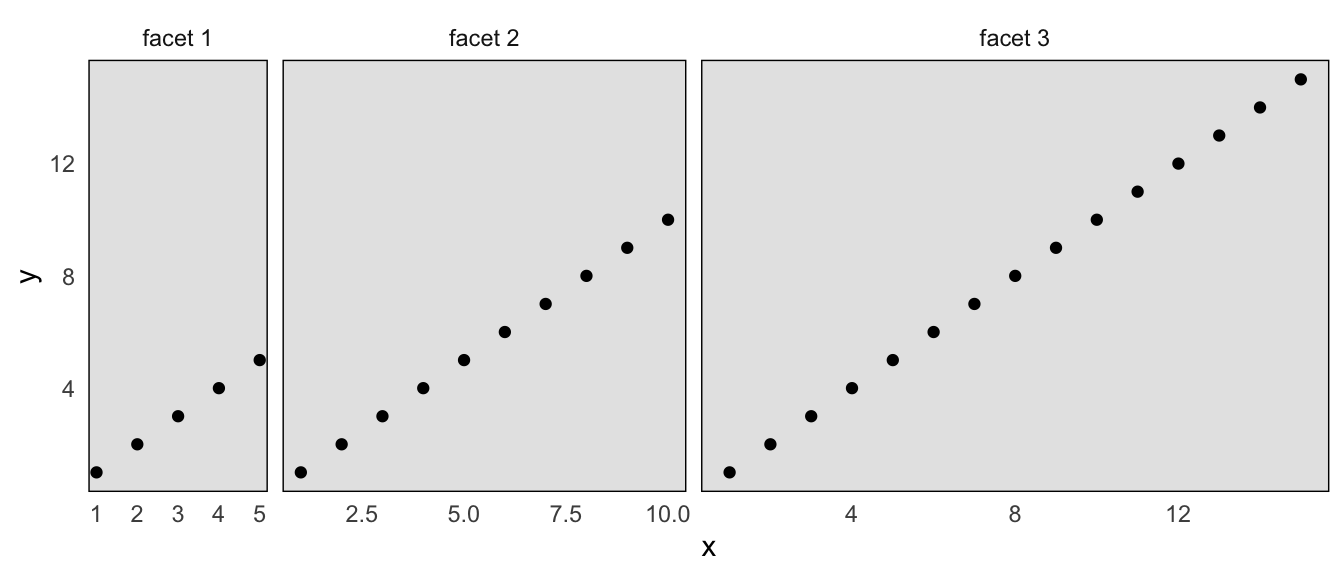
二次元に並べたfacetで範囲ごとに大きさを変える
space引数があるのは、ggplot2::facet_grid()だけで、ggplot2::facet_wrap()にはない。 なので、facet_wrap()を使って自動でいい感じにfacetの大きさを変更することはできない。
facet_grid()
facet_grid()でやりたい場合は、以下のようにするとできるがfacetのラベルをつけることはできない。
# データの準備
tbl_plot <-
  paste("facet", 1:9) %>%
  purrr::imap(~ {
    tibble::tibble(
      facet = .x,
      x = seq_len(.y * 5),
      y = seq_len(.y * 5)
    )
  }) %>%
  dplyr::bind_rows()

plot_point <- function(tbl) {
  ggplot(tbl, aes(x, y)) +
    geom_point() +
    theme_minimal() +
    theme(
      panel.grid = element_blank(),
      panel.background = element_rect(fill = "grey90"),
      axis.ticks = element_line()
    )
}
gp_grid <-
tbl_plot %>%
dplyr::with_groups(facet, tidyr::nest) %>%
dplyr::mutate(
facet_row = rep(1:3, each = 3),
facet_col = rep(1:3, 3)
) %>%
tidyr::unnest(data) %>%
plot_point() +
geom_label(
data = function(df) {
df %>%
dplyr::mutate(x = mean(range(x)), .by = facet_col) %>%
dplyr::mutate(y = mean(range(y)), .by = facet_row)
},
aes(label = facet)) +
facet_grid(rows = vars(facet_row), cols = vars(facet_col), scales = "free", space = "free")
gp_grid
ggh4x::facet_manual(), scale_*_facet()
facetラベルを付けつつ似たようなことをやるには、ggh4x::facet_manual()とggh4x::scale_[xy]_facet()で、 かなり強引に手動で設定することができる。 ただし、この場合は全てのfacetに軸ラベルがついてしまう。
gp_manual <-
  tbl_plot %>%
  plot_point() +
  # `ggh4x::facet_manual()`でfacetの大きさを変更(各facetのscaleは制御できない)
  ggh4x::facet_manual(~ facet, design = matrix(1:9, 3, 3, byrow = TRUE),
                      widths = 7:9, heights =  c(3,6,9), scales = "free") +
  # `ggh4x::scale_[xy]_facet()`で各facetのscaleを設定
  ggh4x::scale_x_facet(facet %in% paste("facet", c(1,4,7)), limits = c(0, 35)) +
  ggh4x::scale_x_facet(facet %in% paste("facet", c(2,5,8)), limits = c(0, 40)) +
  ggh4x::scale_x_facet(facet %in% paste("facet", c(3,6,9)), limits = c(0, 45)) +
  ggh4x::scale_y_facet(facet %in% paste("facet", 1:3), limits = c(0, 15)) +
  ggh4x::scale_y_facet(facet %in% paste("facet", 4:6), limits = c(0, 30)) +
  ggh4x::scale_y_facet(facet %in% paste("facet", 7:9), limits = c(0, 45))
gp_manual
ggh4x::facet_manual(), scale_*_facet() + gtable
gtableパッケージを使えば、不要な軸ラベルを除くことも一応できる。
gt <- ggplotGrob(gp_manual)
grid::grid.newpage(); grid::grid.draw(gt)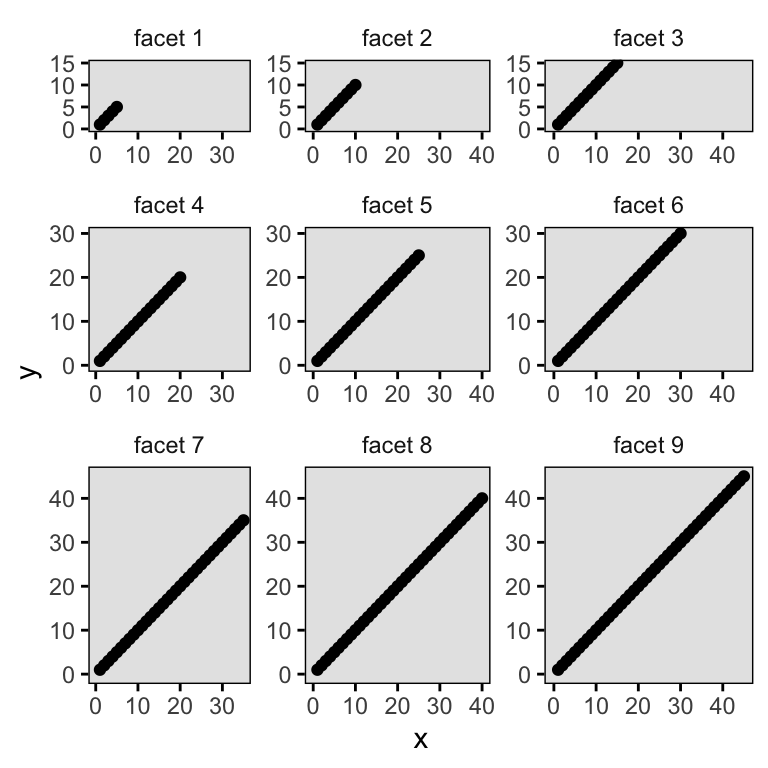
gt_filter <- function(where, x, trim = TRUE) {
  x$layout <- x$layout[where, , drop = FALSE]
  x$grobs <- x$grobs[where]
  if (trim) x <- gtable::gtable_trim(x)
  x
}

# gt$grobsがzeroGrobとなっているセルを除く
gt_filtered <-
  gt$grobs |>
  purrr::map_lgl(~ !identical(.x, ggplot2::zeroGrob())) %>%
  gt_filter(gt)

# 軸ラベルのうち1-2行目のx軸ラベルと2-3列目のy軸ラベルを除く
gt_filtered <-
  grepl("axis-((b-[1-6])|(l-[235689]))", gt_filtered$layout$name) %>%
  {!.} %>%
  gt_filter(gt_filtered)

# レイアウトを確認するには以下を実行
# gtable::gtable_show_layout(gt_filtered)

### セルの間のマージンが大きいのでセル間のマージンをなくす
# gtableのwidths, heightsを渡すと、(数字)nullという表示となる位置を返す関数
# (数字)nullとなるところにプロットがある
which_null <- function(x) grep("\\d+null", format(x))

# 3行あるプロットセルのうち、一番下以外のプロットセルの一つ下のマージンを0mmに設定
gt_filtered$heights[(which_null(gt_filtered$heights)[-3] + 1)] <- unit(0, "mm")
# 3列あるプロットセルのうち、一番左以外のプロットセルの一つ前のマージンを0mmに設定
gt_filtered$widths[(which_null(gt_filtered$widths)[-1] - 1)] <- unit(0, "mm")

# 描画して確認
grid::grid.newpage(); grid::grid.draw(gt_filtered)
比較
patchwork::wrap_plots(gp_grid, gp_manual, gt_filtered, ncol = 3)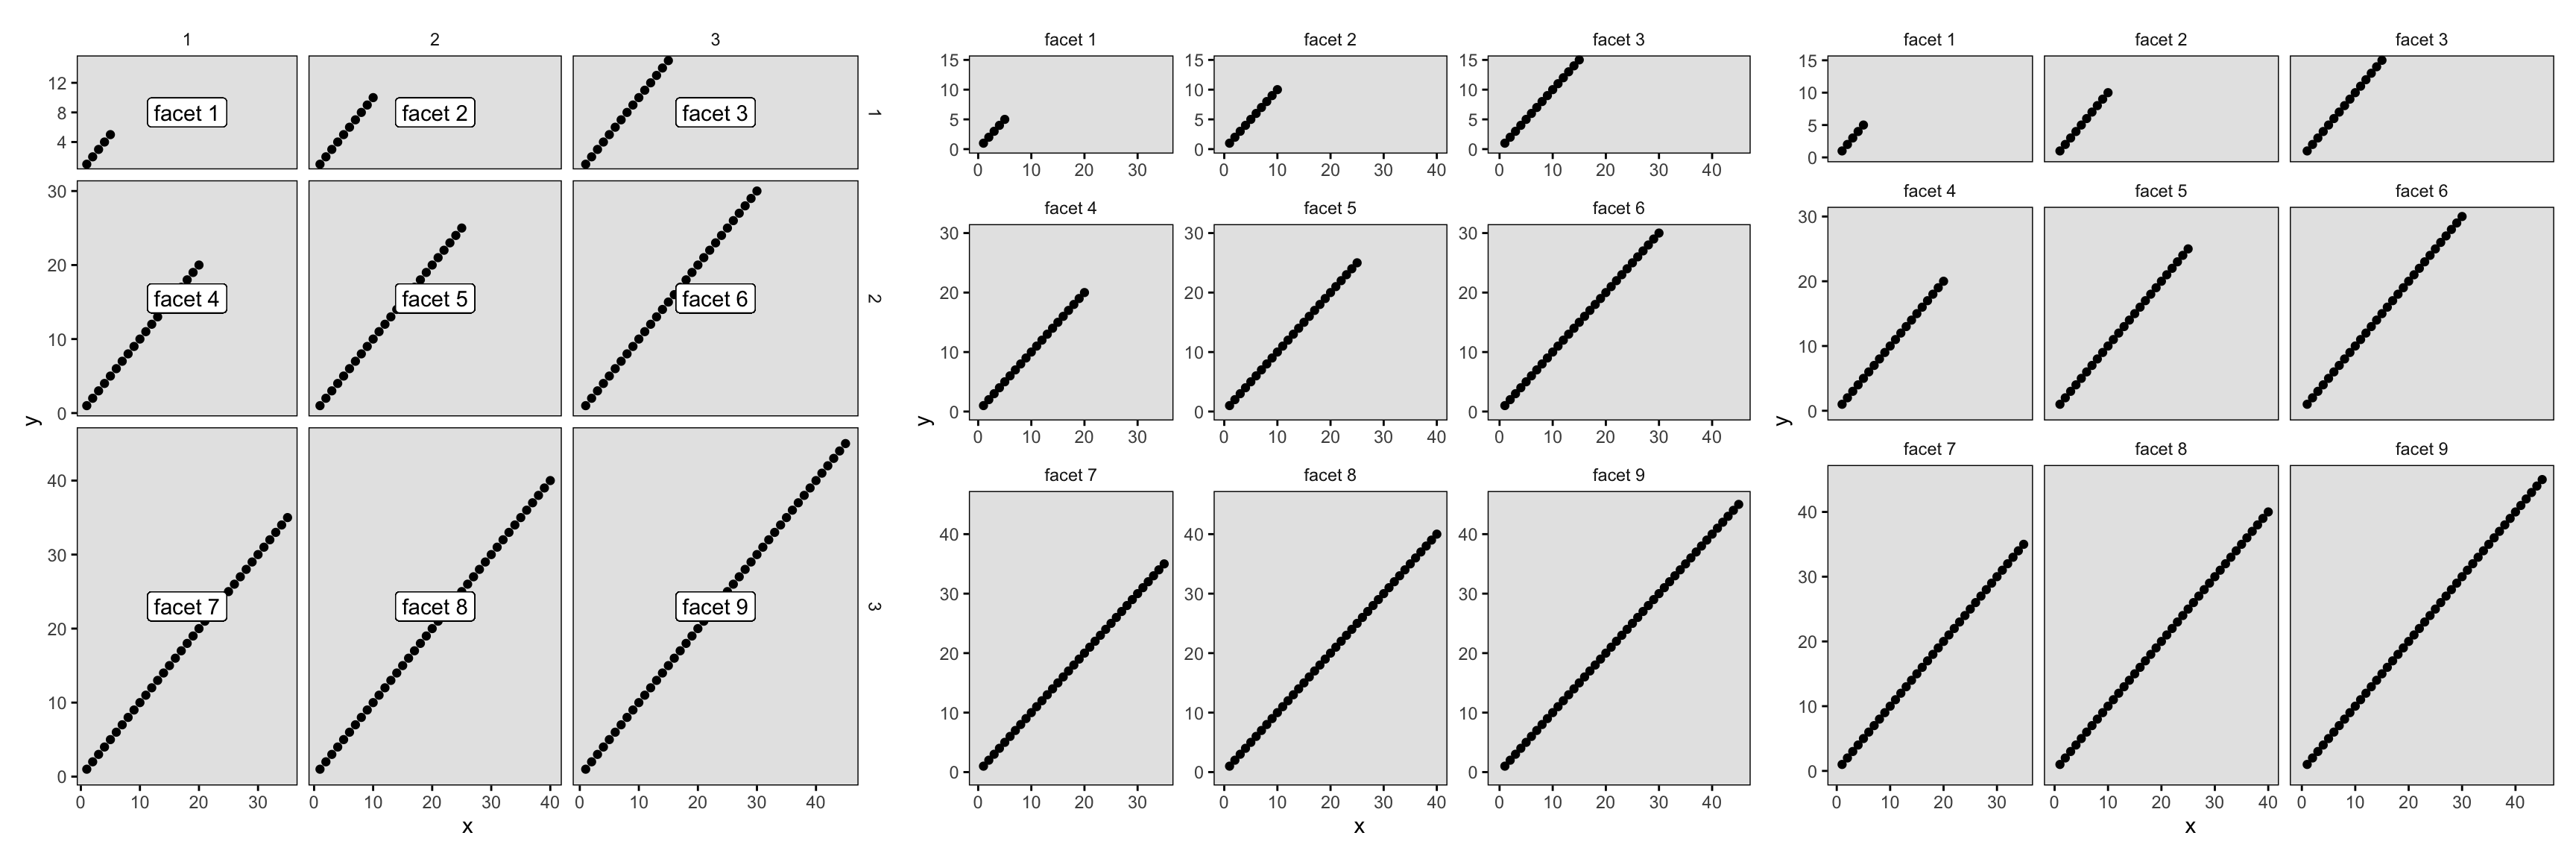
Session info
sessionInfo()R version 4.3.2 (2023-10-31)
Platform: aarch64-apple-darwin20 (64-bit)
Running under: macOS Ventura 13.1
Matrix products: default
BLAS: /Library/Frameworks/R.framework/Versions/4.3-arm64/Resources/lib/libRblas.0.dylib
LAPACK: /Library/Frameworks/R.framework/Versions/4.3-arm64/Resources/lib/libRlapack.dylib; LAPACK version 3.11.0
locale:
[1] en_US.UTF-8/en_US.UTF-8/en_US.UTF-8/C/en_US.UTF-8/en_US.UTF-8
time zone: Asia/Tokyo
tzcode source: internal
attached base packages:
[1] stats graphics grDevices utils datasets methods base
other attached packages:
[1] ggplot2_3.5.1 magrittr_2.0.3
loaded via a namespace (and not attached):
[1] patchwork_1.2.0 vctrs_0.6.5 cli_3.6.3 knitr_1.48
[5] rlang_1.1.4 xfun_0.46 purrr_1.0.2 generics_0.1.3
[9] jsonlite_1.8.8 labeling_0.4.3 glue_1.7.0 ggh4x_0.2.8
[13] colorspace_2.1-1 htmltools_0.5.7 scales_1.3.0 fansi_1.0.6
[17] rmarkdown_2.25 grid_4.3.2 evaluate_0.24.0 munsell_0.5.1
[21] tibble_3.2.1 fastmap_1.1.1 yaml_2.3.9 lifecycle_1.0.4
[25] compiler_4.3.2 dplyr_1.1.4 htmlwidgets_1.6.4 pkgconfig_2.0.3
[29] tidyr_1.3.1 farver_2.1.2 digest_0.6.34 R6_2.5.1
[33] tidyselect_1.2.1 utf8_1.2.4 pillar_1.9.0 withr_3.0.0
[37] tools_4.3.2 gtable_0.3.5