library(magrittr)
library(ggplot2)動機
縦横の要素数が異なる複数のヒートマップをggplot2を用いて作成した場合、 セルの大きさをヒートマップ間で揃えるためにはどうしたらいいか知りたかった。
Load packages
ヒートマップ作成
make_heatmap <- function(n) {
  set.seed(n)
  tbl_plot <-
    tibble::tibble(
      y = as.character(seq_len(n)),
      V1 = rnorm(n),
      V2 = rnorm(n),
      V3 = rnorm(n),
      V4 = rnorm(n),
      V5 = rnorm(n)
    ) %>%
    tidyr::pivot_longer(cols = !y, names_to = "x")
  gp <-
    ggplot(tbl_plot, aes(x, y)) +
    geom_tile(aes(fill = value)) +
    scale_x_discrete(expand = expansion(0)) +
    scale_y_discrete(expand = expansion(0)) +
    scale_fill_gradient2()
}
gp1 <-  make_heatmap(5)
gp2 <-  make_heatmap(10)

# 普通に作成したヒートマップはセルの大きさが揃えられない。
patchwork::wrap_plots(gp1, gp2)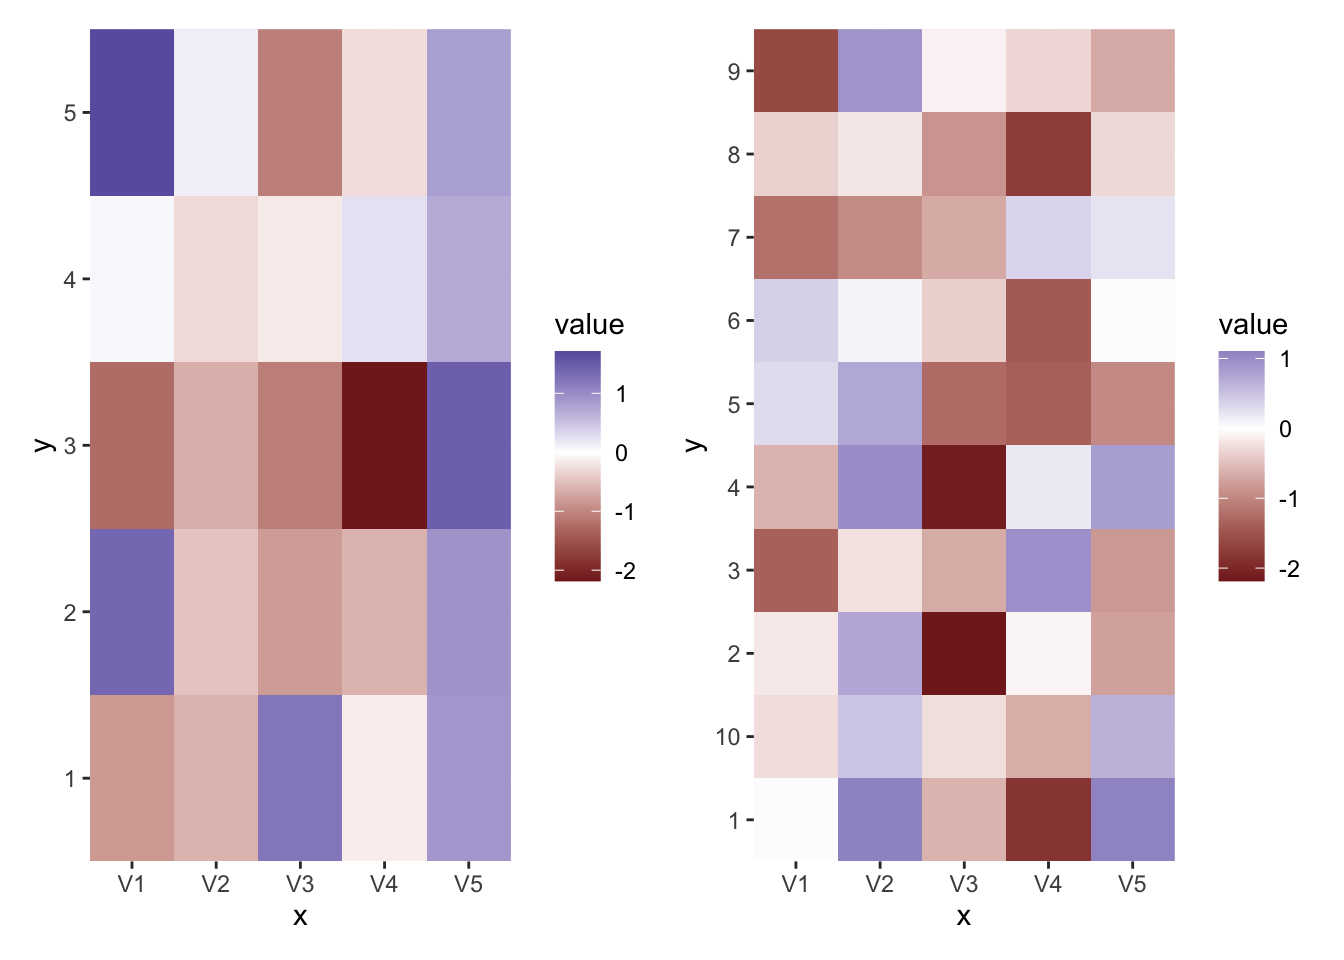
プロットの調整
# プロットの各要素の大きさを細かく指定するためにw、gtableオブジェクトに変換する。
gt1 <- ggplotGrob(gp1)
gt2 <- ggplotGrob(gp2)

# gtableオブジェクトのレイアウトを確認する。真ん中 (7, 5)のgrobのサイズが1nullとなっている。
# この部分のサイズを指定してやれば、ヒートマップのセルの大きさを揃えられる。
gtable::gtable_show_layout(gt1)
gt1$heights [1] 5.5points
[2] 0points
[3] 0cm
[4] 0cm
[5] 0cm
[6] 0points
[7] 0cm
[8] 0cm
[9] 1null
[10] sum(0.0966514459665145cm, max(0points, -0.0966514459665145cm), 0.364876393040526cm, 0cm)
[11] 1grobheight
[12] 0points
[13] 0cm
[14] 0cm
[15] 0points
[16] 5.5points # "1null"と表示されるセルの位置を見つける関数
where_1null <- function(u) which(format(u) == "1null")
# 縦横を指定する。各セルの高さを5 mm、幅を10 mmとして計算して指定する。
gt1$heights[where_1null(gt1$heights)] <- ggplot2::unit(5*5, units = "mm")
gt2$heights[where_1null(gt2$heights)] <- ggplot2::unit(5*10, units = "mm")
gt1$widths[where_1null(gt1$widths)] <- ggplot2::unit(10*5, units = "mm")
gt2$widths[where_1null(gt2$widths)] <- ggplot2::unit(10*5, units = "mm")
# セルの大きさが揃うかを確認
patchwork::wrap_plots(gt1, gt2) # あるいは gridExtra::grid.arrange(gt1, gt2, ncol = 2)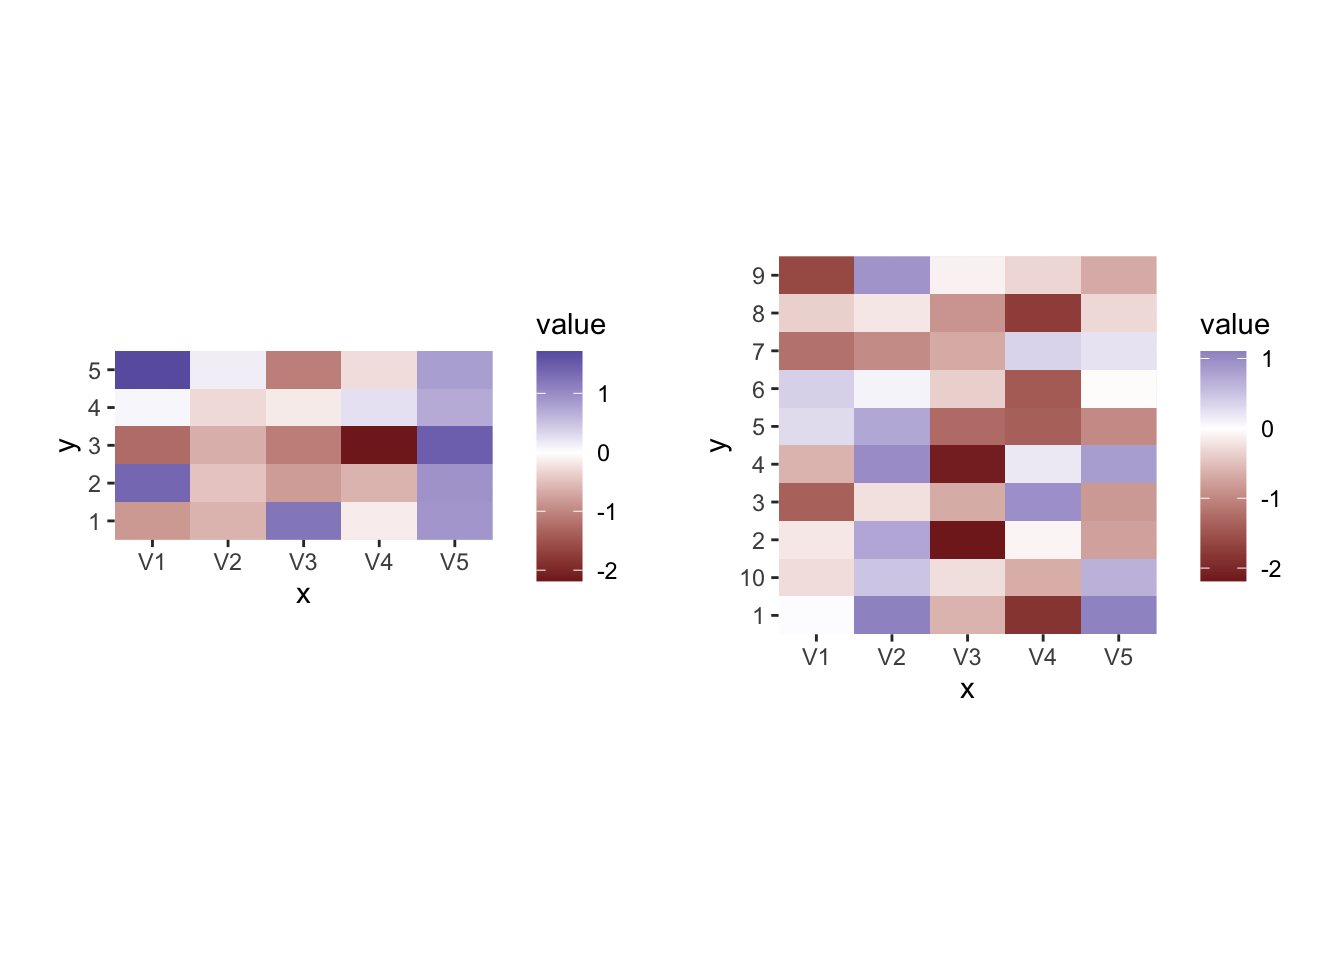
ファイル出力時に注意すること
# ファイルに出力する際には自動でサイズ調整はされないので、プロット全体のサイズを指定する。
# gtableの縦横の合計をmmで計算する関数を定義
calc_mm <- function(x) sum(grid::convertUnit(x, "mm"))

# ファイル出力
outf1 <- tempfile(fileext = ".png")
ggsave(outf1, gt1, width = calc_mm(gt1$widths), height = calc_mm(gt1$heights), units = "mm")
outf2 <- tempfile(fileext = ".png")
ggsave(outf2, gt2, width = calc_mm(gt2$widths), height = calc_mm(gt2$heights), units = "mm")

# 出力したファイルを読み込んで意図通りになっているかチェック
# 小さい方のレジェンドが見切れてはいるが、左右のヒートマップでセルの大きさは揃っている。
im1 <- magick::image_read(outf1)
im2 <- magick::image_read(outf2)
magick::image_append(c(im1, im2))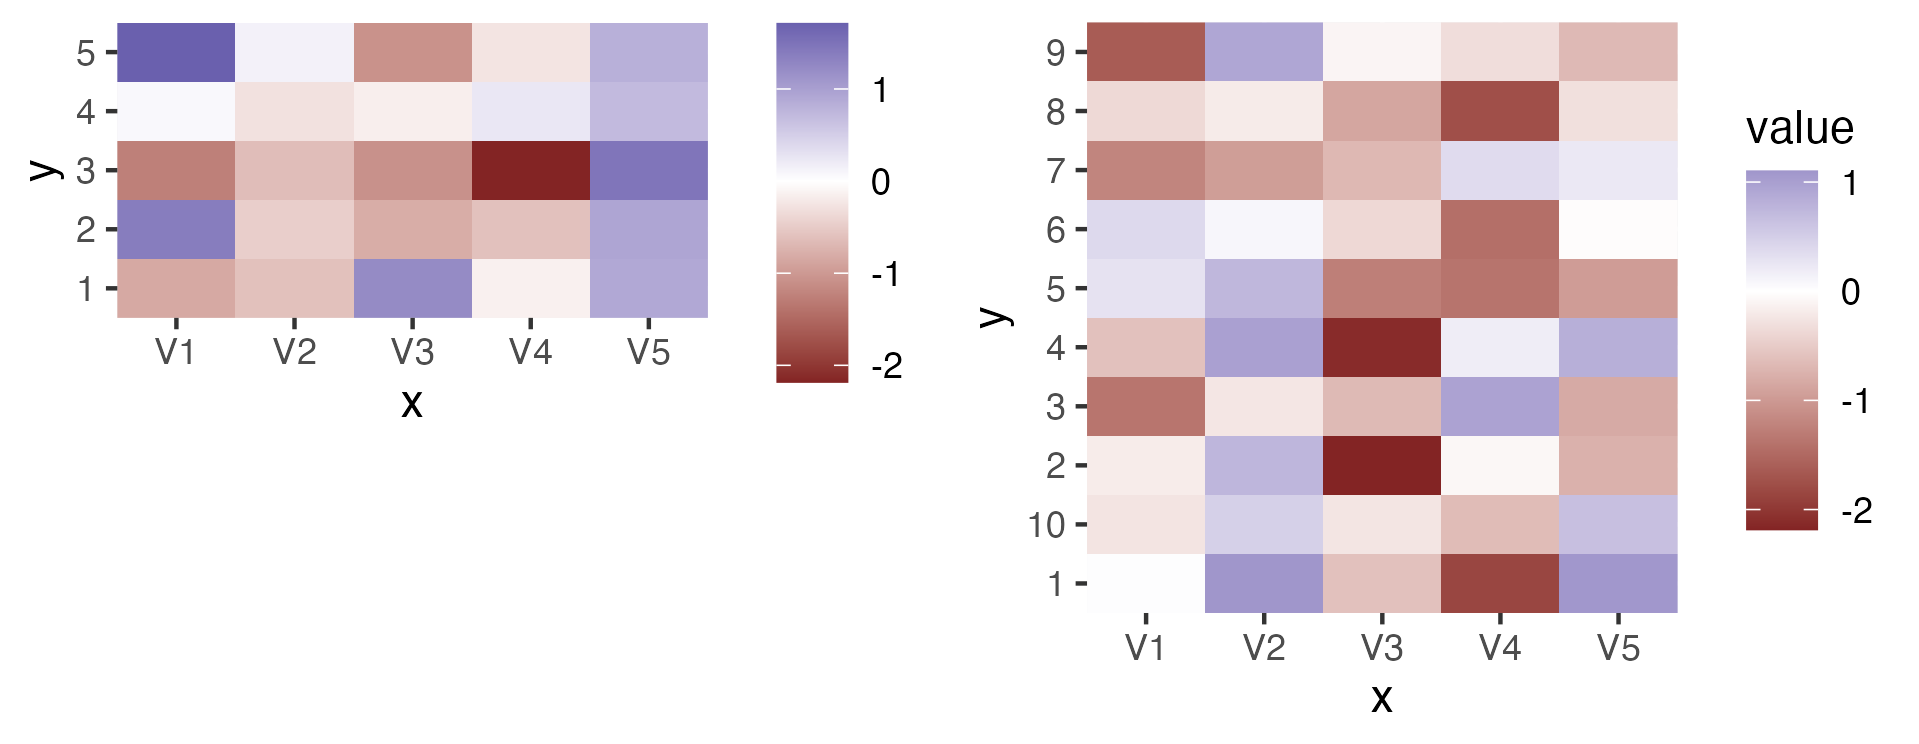
参考
ggplot2で縦に並べたグラフの横幅を揃える - もうカツ丼はいいよな
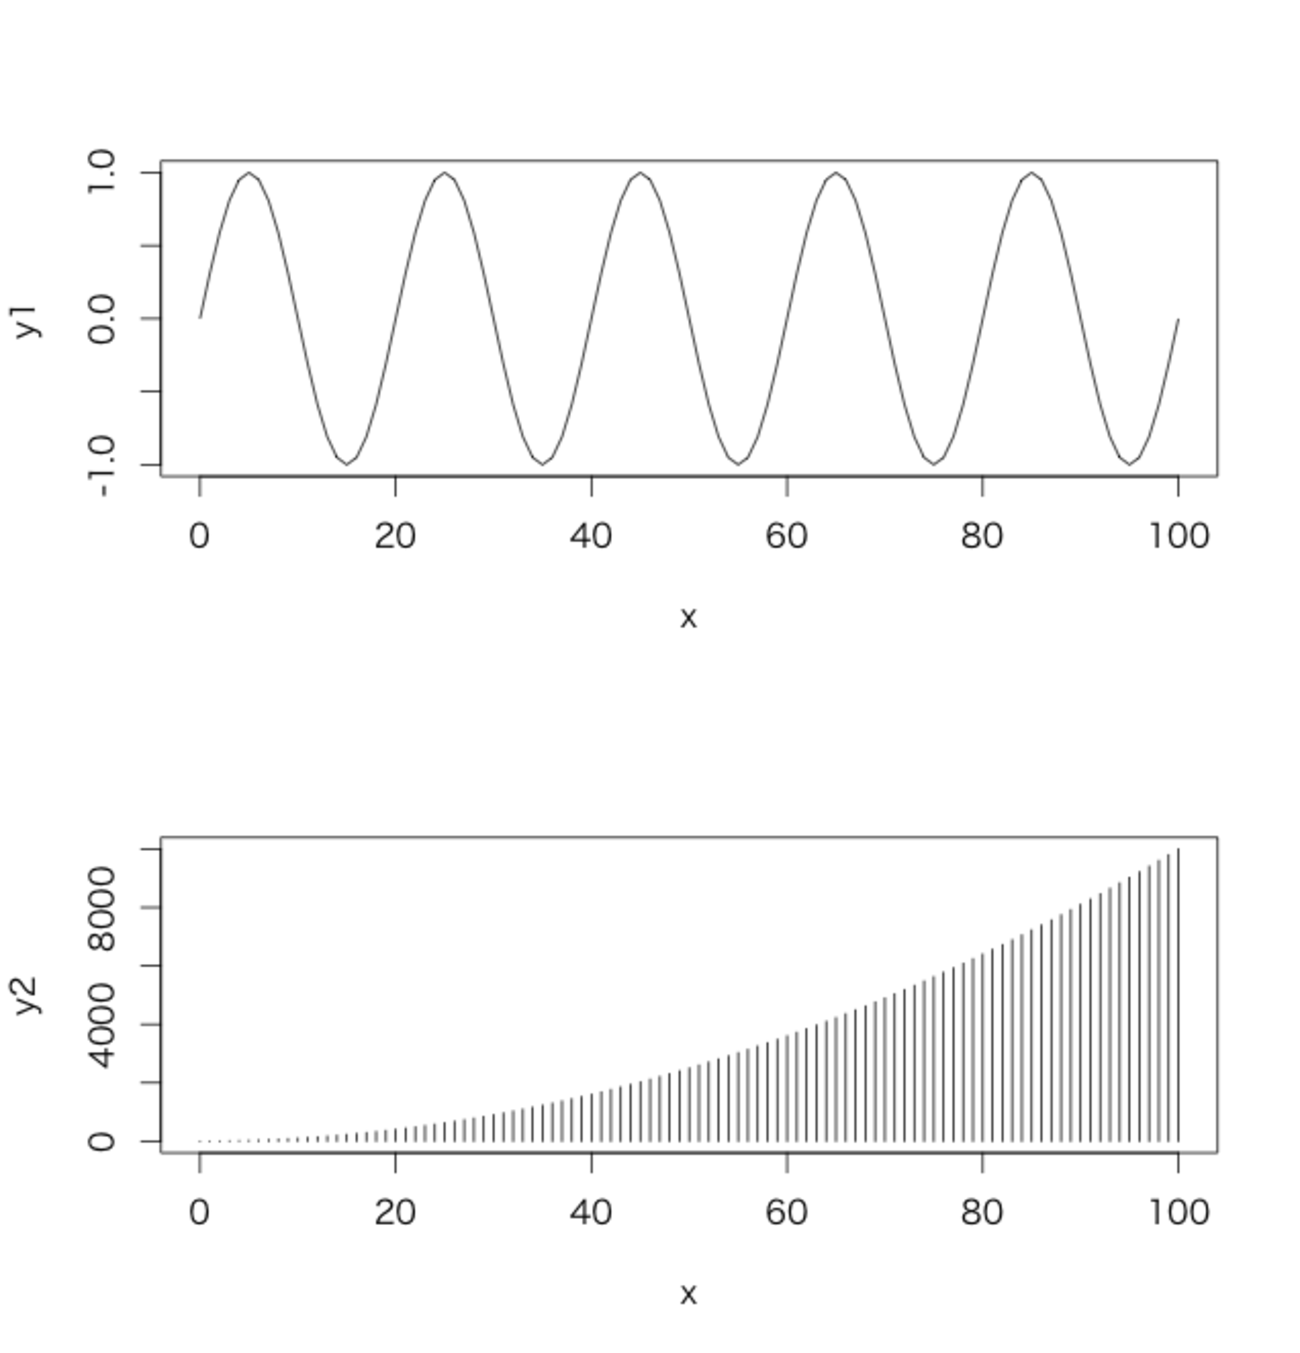
(※2015/06/03 20:27追記あり) 下記の記事に基づく発言に関連してどうも某所で勘違いが発生しているようなので。R Recipe: Aligning Axes in ggplot2 | Exegetic Analyticswww.exegetic.biz 使用データ 下記のように生成したものを用いる。 x <- 0:100 x <- data.frame(x = x, y1 = sin(x * pi / 10), y2 = x^2) なぜ横幅がずれるのか まず、これをbaseで普通にプロットする。 layout(matrix(1:2, 2)) plot(y1 ~ x, type =…
https://rion778.hatenablog.com/entry/2015/06/03/011256
ggplot2、grid、gtable、gridExtraの関係とか - Technically, technophobic.
追記(2017/05/04): gridExtraのwikiのURLが変わっていたので修正しました。 久々にggplot2のIssueを眺めてたら、gridExtraの作者が超有用ドキュメントを書いてるのを見つけたのでメモ。
https://notchained.hatenablog.com/entry/2015/12/17/010904
Tabular grid - ggplot2 book
 https://ggplot2-book.org/ext-springs#sec-tabular-grid
Session info
sessionInfo()R version 4.3.2 (2023-10-31)
Platform: aarch64-apple-darwin20 (64-bit)
Running under: macOS Ventura 13.1
Matrix products: default
BLAS: /Library/Frameworks/R.framework/Versions/4.3-arm64/Resources/lib/libRblas.0.dylib
LAPACK: /Library/Frameworks/R.framework/Versions/4.3-arm64/Resources/lib/libRlapack.dylib; LAPACK version 3.11.0
locale:
[1] en_US.UTF-8/en_US.UTF-8/en_US.UTF-8/C/en_US.UTF-8/en_US.UTF-8
time zone: Asia/Tokyo
tzcode source: internal
attached base packages:
[1] stats graphics grDevices utils datasets methods base
other attached packages:
[1] ggplot2_3.5.1 magrittr_2.0.3
loaded via a namespace (and not attached):
[1] gtable_0.3.5 jsonlite_1.8.8 dplyr_1.1.4 compiler_4.3.2
[5] Rcpp_1.0.13 tidyselect_1.2.1 magick_2.8.2 tidyr_1.3.1
[9] png_0.1-8 systemfonts_1.1.0 scales_1.3.0 textshaping_0.4.0
[13] yaml_2.3.9 fastmap_1.1.1 R6_2.5.1 labeling_0.4.3
[17] generics_0.1.3 patchwork_1.2.0 knitr_1.48 htmlwidgets_1.6.4
[21] tibble_3.2.1 munsell_0.5.1 pillar_1.9.0 rlang_1.1.4
[25] utf8_1.2.4 xfun_0.46 cli_3.6.3 withr_3.0.0
[29] digest_0.6.34 grid_4.3.2 lifecycle_1.0.4 vctrs_0.6.5
[33] evaluate_0.24.0 glue_1.7.0 farver_2.1.2 ragg_1.3.2
[37] fansi_1.0.6 colorspace_2.1-1 rmarkdown_2.25 purrr_1.0.2
[41] tools_4.3.2 pkgconfig_2.0.3 htmltools_0.5.7