library(magrittr)
library(ggplot2)動機
一つのプロットにおける複数のデータについて、別々のカラースケールを使いたい時。
Load packages
ダメな例
irisのSepal (萼片) とPetal (花弁) を同じ一つの散布図にそれぞれ分けて作図することを考える。 どちらもSpeciesで色分けしたいが、SepalとPetalで色分けを変えたい場合どうするか?
以下のように、それぞれの散布図(geom_point)の下に、 そのままそれぞれの色を指定する(scale_color_viridis_d)と、 古い色の指定は新しいカラースケールに上書きされて、 Sepal、Petal両方に同じカラースケールが適用される。
Code
theme_scatter <- function() {
  list(
    theme_void(base_size = 14),
    theme(
      panel.background = element_rect(fill = "grey80")
    )
  )
}
(gp1 <-
iris %>%
ggplot(aes(Sepal.Length, Sepal.Width)) +
geom_point(aes(color = Species), size = 2) +
scale_color_viridis_d(option = "A", begin = .1, end = .5) +
geom_point(
aes(Petal.Length, Petal.Width, color = Species),
shape = 2, size = 2
) +
scale_color_viridis_d(option = "D", begin = .1, end = .5) +
theme_scatter())Scale for colour is already present.
Adding another scale for colour, which will replace the existing scale.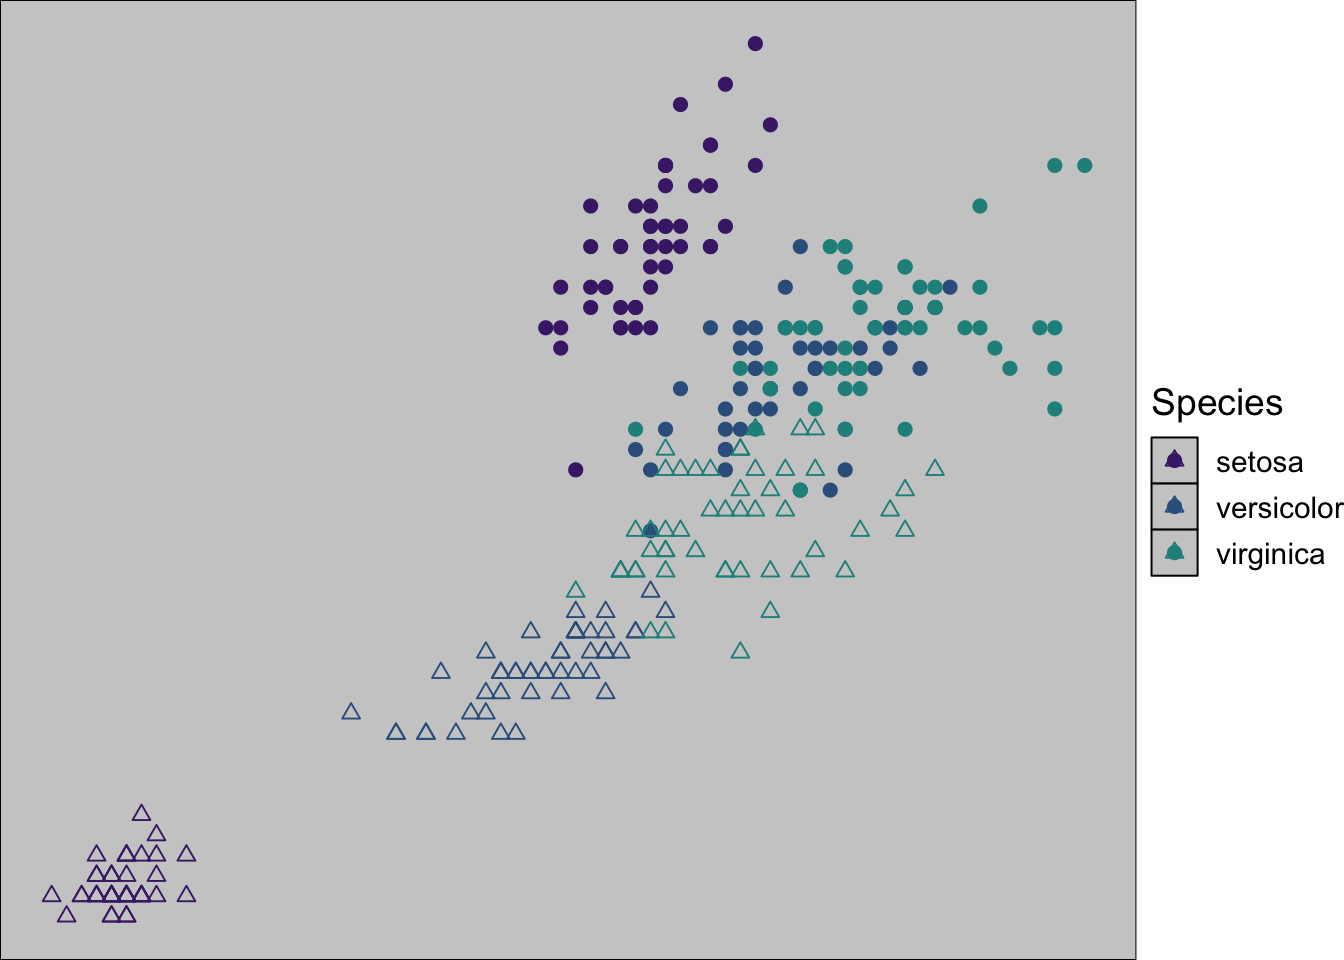
ggnewscaleパッケージを使う
ggnewscale::new_scale_color()を各スケールの間に挟むと、別のscale_color_*()が利用できる。
(gp2 <-
   iris %>%
   ggplot(aes(Sepal.Length, Sepal.Width)) +
   geom_point(aes(color = Species), size = 2) +
   scale_color_viridis_d(option = "A", begin = .1, end = .5) +
   ggnewscale::new_scale_color() +
   geom_point(
     aes(Petal.Length, Petal.Width, color = Species),
     shape = 2, size = 2
   ) +
   scale_color_viridis_d(option = "D", begin = .1, end = .5) +
   theme_scatter())
凡例を分ける
凡例を別々にコントロールしたい時は、scale_color_*()のguide引数にguide_*()を渡す。
(gp3 <-
   iris %>%
   ggplot(aes(Sepal.Length, Sepal.Width)) +
   geom_point(aes(color = Species), size = 2) +
   scale_color_viridis_d(option = "A", begin = .1, end = .5) +
   ggnewscale::new_scale_color() +
   geom_point(
     aes(Petal.Length, Petal.Width, color = Species),
     shape = 2, size = 2
   ) +
   scale_color_viridis_d(option = "D", begin = .1, end = .5,
                         guide = guide_legend(title = "new")) +
   theme_scatter())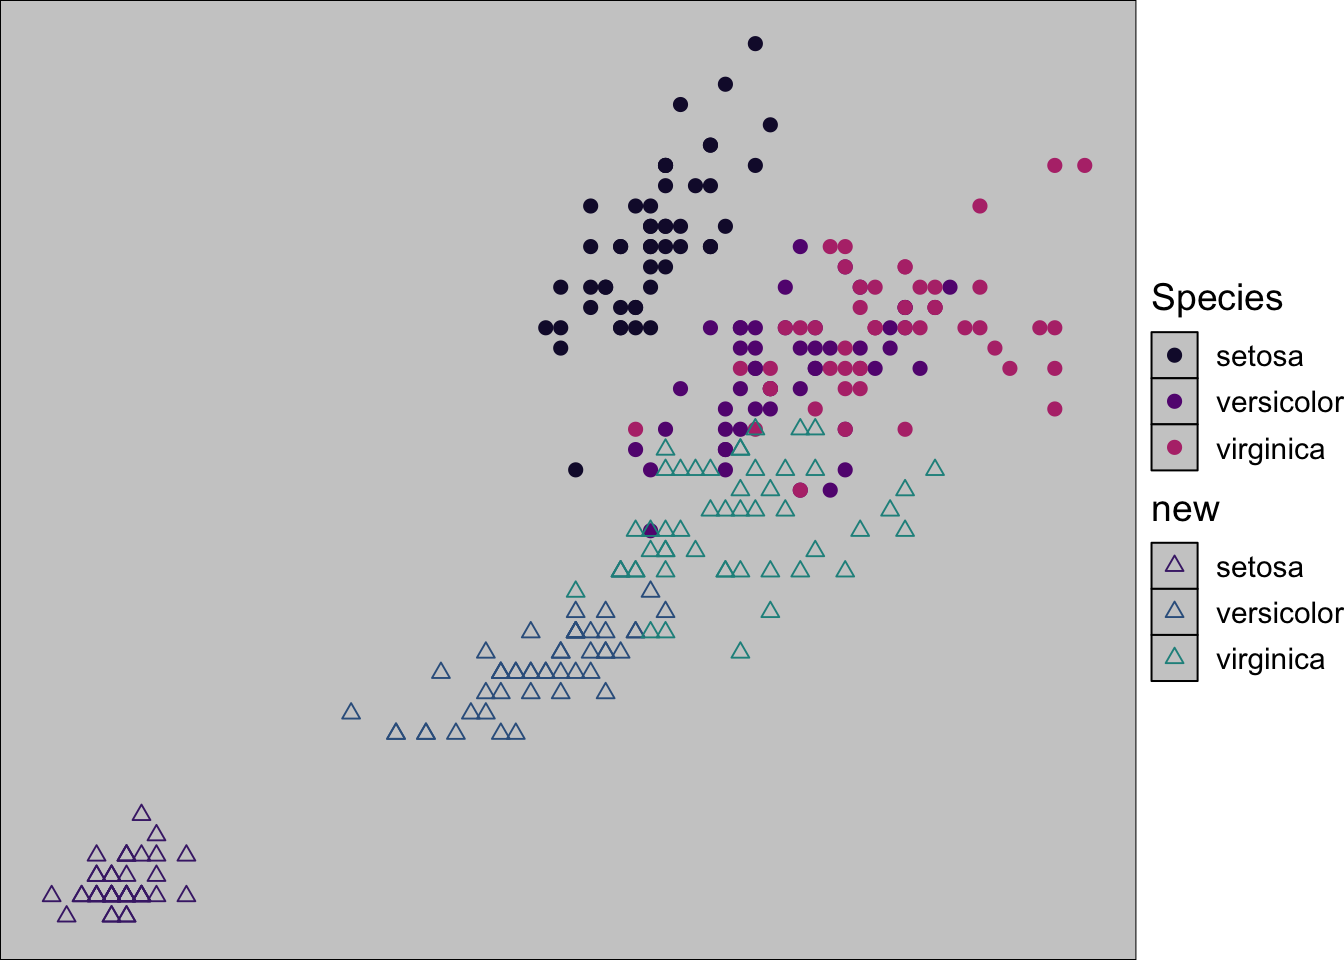
facetでも分けて、色も分ける場合
描画するデータをdplyr::filter()で分けて、複数回プロットすればよい。
tbl_plot <-
  iris %>%
  tibble::as_tibble() %>%
  dplyr::mutate(rn = dplyr::row_number()) %>%
  tidyr::pivot_longer(cols = !c(Species, rn)) %>%
  dplyr::mutate(
    part = stringr::str_extract(name, "^[^.]+"),
    measure = stringr::str_extract(name, "[^.]+$"),
  ) %>%
  dplyr::select(!name) %>%
  tidyr::pivot_wider(names_from = measure, values_from = value)
tbl_plot
# A tibble: 300 × 5
Species rn part Length Width
<fct> <int> <chr> <dbl> <dbl>
1 setosa 1 Sepal 5.1 3.5
2 setosa 1 Petal 1.4 0.2
3 setosa 2 Sepal 4.9 3
4 setosa 2 Petal 1.4 0.2
5 setosa 3 Sepal 4.7 3.2
6 setosa 3 Petal 1.3 0.2
7 setosa 4 Sepal 4.6 3.1
8 setosa 4 Petal 1.5 0.2
9 setosa 5 Sepal 5 3.6
10 setosa 5 Petal 1.4 0.2
# ℹ 290 more rowstbl_plot %>%
ggplot(aes(Length, Width, shape = part)) +
geom_point(data = \(df) dplyr::filter(df, part == "Petal"), aes(color = Species)) +
ggnewscale::new_scale_color() +
geom_point(data = \(df) dplyr::filter(df, part == "Sepal"), aes(color = Species)) +
scale_color_viridis_d(option = "B", guide = guide_legend(title = "Species for Sepal")) +
facet_wrap(~ part, scales = "free") +
theme_scatter()
ggnewscale::new_scale_color()は何回も使える
plot_facet <- function(temp_facet, temp_option) {
  list(
    geom_point(data = \(df) dplyr::filter(df, facet == temp_facet), aes(color = Species)),
    scale_color_viridis_d(begin = .1, end = .9, option = temp_option, guide = guide_legend(title = temp_option))
  )
}

purrr::map(1:6, ~ dplyr::mutate(dplyr::slice_head(iris, n = 10, by = Species), facet = .x)) %>%
  dplyr::bind_rows() %>%
  ggplot(aes(Sepal.Length, Sepal.Width)) +
  plot_facet(1, "A") +
  ggnewscale::new_scale_colour() +
  plot_facet(2, "B") +
  ggnewscale::new_scale_colour() +
  plot_facet(3, "C") +
  ggnewscale::new_scale_colour() +
  plot_facet(4, "D") +
  ggnewscale::new_scale_colour() +
  plot_facet(5, "E") +
  ggnewscale::new_scale_colour() +
  plot_facet(6, "F") +
  facet_wrap(~ facet) +
  theme_scatter() +
  theme(legend.direction = "horizontal",
        legend.margin = margin(),
        legend.spacing.y = unit(2, "mm"))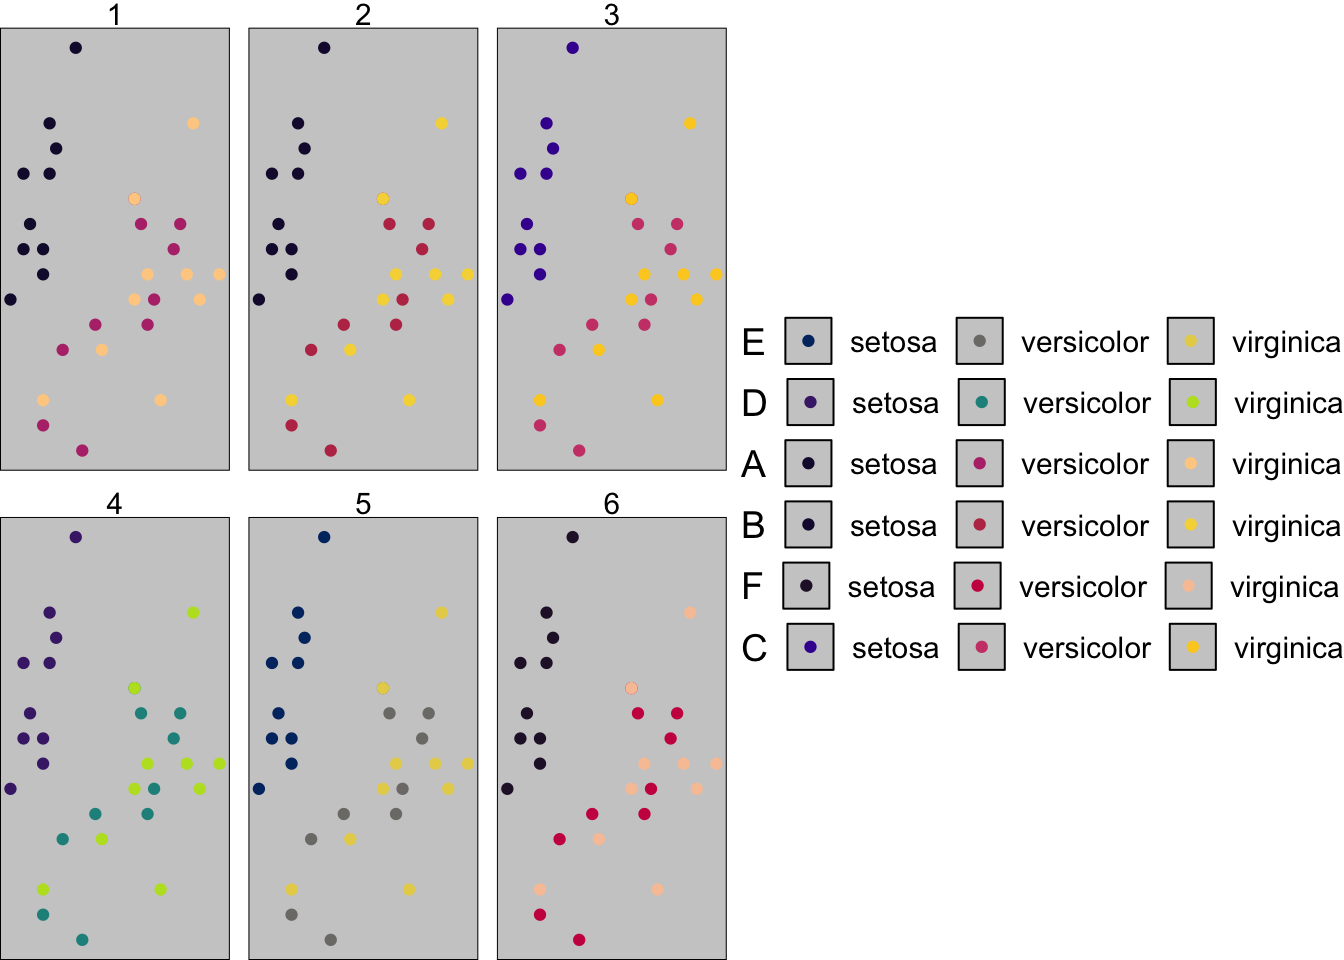
Session info
sessionInfo()R version 4.3.2 (2023-10-31)
Platform: aarch64-apple-darwin20 (64-bit)
Running under: macOS Ventura 13.1
Matrix products: default
BLAS: /Library/Frameworks/R.framework/Versions/4.3-arm64/Resources/lib/libRblas.0.dylib
LAPACK: /Library/Frameworks/R.framework/Versions/4.3-arm64/Resources/lib/libRlapack.dylib; LAPACK version 3.11.0
locale:
[1] en_US.UTF-8/en_US.UTF-8/en_US.UTF-8/C/en_US.UTF-8/en_US.UTF-8
time zone: Asia/Tokyo
tzcode source: internal
attached base packages:
[1] stats graphics grDevices utils datasets methods base
other attached packages:
[1] ggplot2_3.5.1 magrittr_2.0.3
loaded via a namespace (and not attached):
[1] vctrs_0.6.5 cli_3.6.3 knitr_1.48 rlang_1.1.4
[5] xfun_0.46 stringi_1.8.4 purrr_1.0.2 generics_0.1.3
[9] jsonlite_1.8.8 labeling_0.4.3 glue_1.7.0 colorspace_2.1-1
[13] htmltools_0.5.7 scales_1.3.0 fansi_1.0.6 rmarkdown_2.25
[17] grid_4.3.2 evaluate_0.24.0 munsell_0.5.1 tibble_3.2.1
[21] fastmap_1.1.1 yaml_2.3.9 lifecycle_1.0.4 stringr_1.5.1
[25] compiler_4.3.2 dplyr_1.1.4 htmlwidgets_1.6.4 pkgconfig_2.0.3
[29] tidyr_1.3.1 farver_2.1.2 digest_0.6.34 viridisLite_0.4.2
[33] R6_2.5.1 tidyselect_1.2.1 utf8_1.2.4 pillar_1.9.0
[37] withr_3.0.0 tools_4.3.2 gtable_0.3.5 ggnewscale_0.5.0